The Death of Static Dashboards — And What Replaces Them
The Death of Static Dashboards — And What Replaces Them
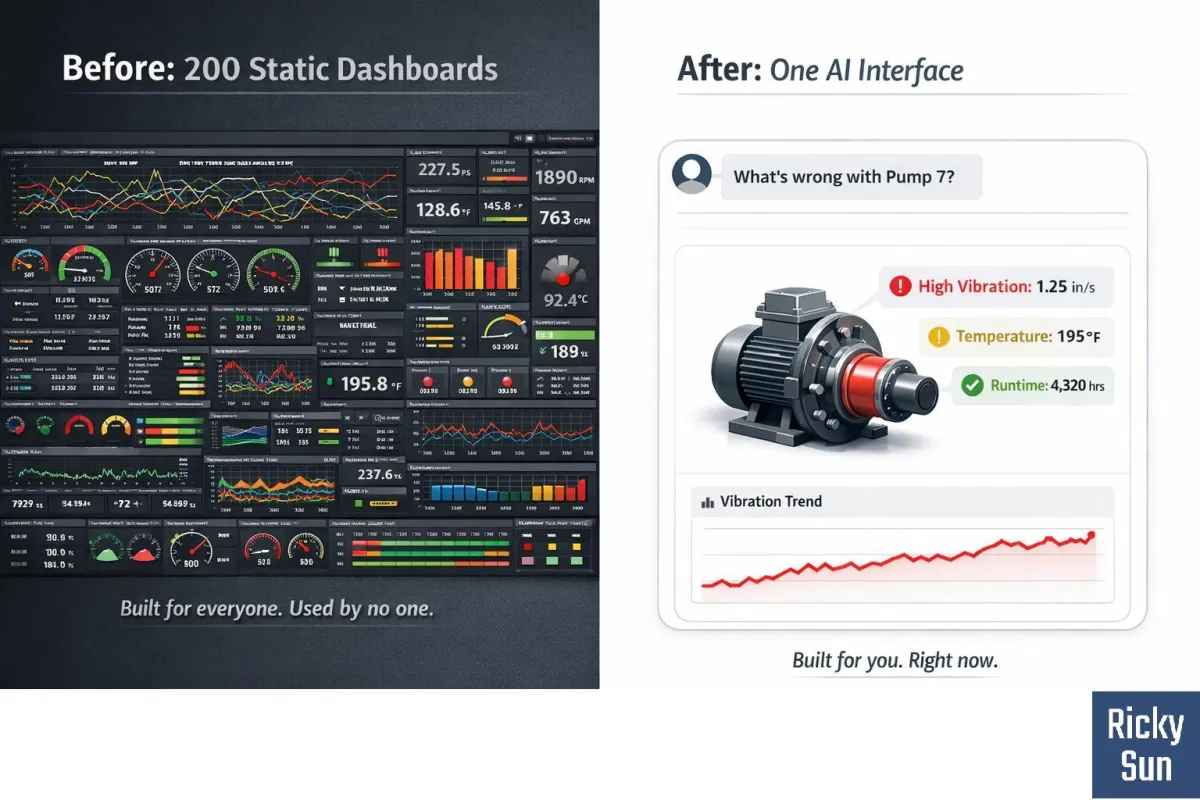
Your PI Vision environment has 200 displays.
How many does anyone actually use?
Most companies won’t admit the answer.
But you already know it.
They spend $100K–$150K building dashboards that operators click through once… and never open again.
This isn’t a tooling problem.
It’s a model problem.
The Illusion of Visibility
Dashboards feel productive because they’re visible.
They give leadership something to point at:
“We have real-time data.”
“We’re digital.”
“We’re data-driven.”
But operators don’t care about dashboards.
They care about answers:
What’s wrong?
What needs attention?
What do I do next?
Dashboards don’t answer those questions.
They force users to go looking for them.
Why Dashboards Fail at Scale
1. They Assume You Know the Question in Advance
You don’t.
Every role, every shift, every situation creates new questions.
Static dashboards can’t keep up with dynamic reality.
2. They’re Built for “Everyone”
Which means they’re built for no one.
Too much data for operators
Not enough context for managers
Wrong granularity for engineers
So people stop using them.
3. They Create Bottlenecks
Every request turns into:
“Can you add this tag?”
“Can you modify this display?”
“Can we get a new report?”
Now you’re waiting days or weeks…
For something that should take seconds.
The Shift: From Dashboards to Intelligence
Here’s what’s changing:
Dashboards are becoming infrastructure.
AI is becoming the interface.
Instead of navigating pre-built displays…
Users simply ask.
What This Looks Like in the Real World
Operator
“What’s wrong with Pump 7?”
AI responds with:
Live conditions
Deviations from normal
Relevant trends
Likely causes
No clicking. No searching. No training.
Plant Manager
“How did night shift perform?”
AI generates:
Throughput vs target
Downtime breakdown
Quality issues
Key anomalies
Not a generic report — a contextual answer.
Reliability Engineer
“Show me vibration trends across all rotating equipment.”
AI compiles:
Cross-asset trends
Pattern detection
Outliers
In seconds. No tickets. No delays.
The New Architecture

PI Vision, Seeq, PowerBI — they don’t disappear.
They become rendering engines.
The interface becomes intelligence.
The Strategic Implication
This isn’t just a better interface.
It changes how decisions get made.
Whoever builds the AI layer on top of the historian controls:
What signals get prioritized
How problems are framed
What actions get taken
And in operations, how you see the problem determines how fast you solve it.
The companies that win won’t have more data.
They’ll have faster, clearer interpretation of that data.
This is no longer a reporting problem.
It’s a decision-speed problem.
Why This Matters Now
Most companies are still:
Maintaining unused dashboards
Expanding report libraries
Hiring more analysts
While a new model is already emerging.
Soon the gap will be obvious:
One company gets answers in seconds.
Another waits weeks.
That gap compounds.
Fast.
The Real Question
This shift isn’t hypothetical.
It’s inevitable.
The real question is:
Who builds the AI layer on top of your data?
Your internal team?
A vendor?
Or your competitor — who moves first and sets the standard?
What To Do Next
1. Audit What’s Actually Used
Find out:
Which dashboards get opened
By whom
For what decisions
Remove everything else.
2. Identify High-Value Questions
Document the top questions:
Operators ask daily
Managers ask weekly
Engineers ask during failures
This becomes your blueprint.
3. Design for Answers, Not Displays
Stop asking:
“What dashboards do we need?”
Start asking:
“What decisions need to happen instantly?”
4. Start Building the AI Layer
You don’t need perfection.
Even simple steps create leverage:
Natural language queries
AI-assisted diagnostics
Context-aware summaries
The goal is speed to insight.
Bottom Line
Dashboards gave you access to data.
AI gives you access to answers.
The companies that win won’t have more dashboards.
They’ll have more clarity.
And in operations, clarity is everything.